
Introduction#
- Observability for EKS EC2 with CWAgent and Fluent Bit
- Observability for EKS Faragate with ADOT
- Observability for a cluster with EC2 and Faragate
- cAdvisor
Observability for EKS EC2#
There are serveral methods
- Applications send logs
- Sidecar container pattern
- Node agent (the most common method)
Depending on EC2 or Fargate, there are different tools
- Container Insights: CloudWatch Agent and Fluent Bit installed per node
- ADOT (AWS Distro for OpenTelemetry) works for both EC2 and Fargate
As the cluster using both EC2 nodegroup and Faragate profile
- Setup CloudWatch Agent and Fluent-bit for EC2 nodegroup
- Setup ADOT for Faragate profile
- Also need to setup the metric server
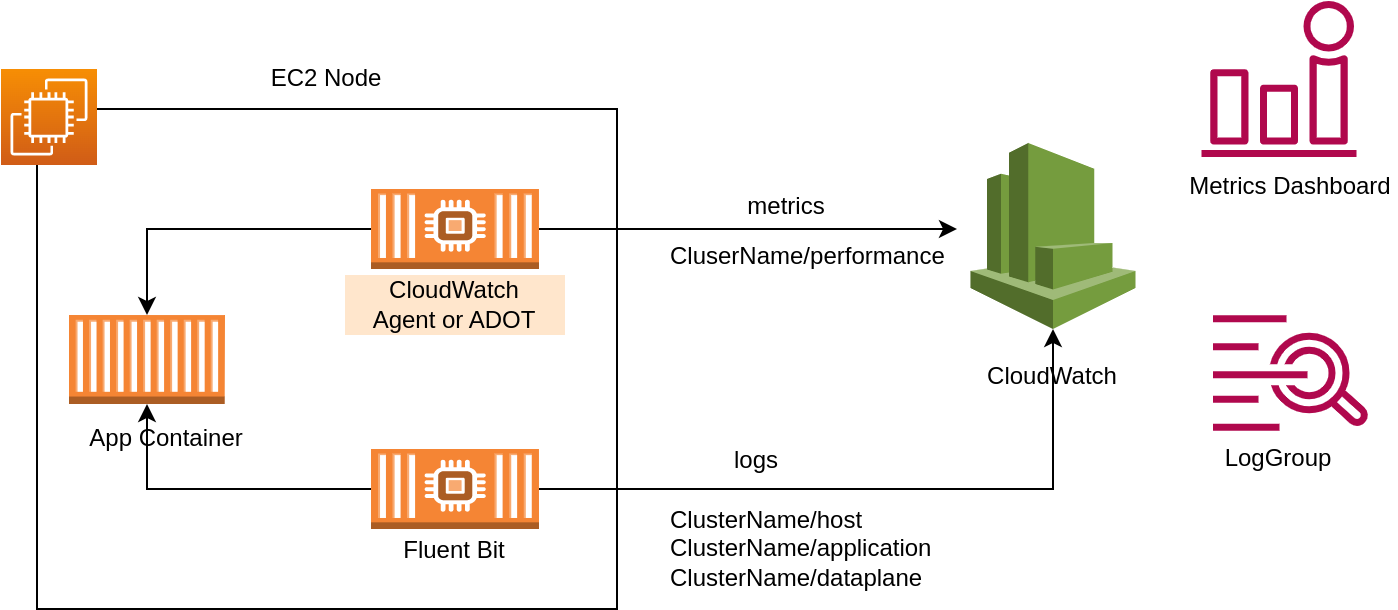
How CloudWatch Agent and Fluent Bit work?
- CloudWatch Agent installed per EC2 Node and collect metrics, then send to performance log group in CW
- Fluent Bit send logs to log groups: host, application, dataplane
Install metric sersver
check the yaml/metric-server.yaml
Install CloudWatch Agent and Fluent-bit in EC2 Nodegroup
- replace region with your target region
- replace cluster-name with your cluster-name
check the yaml/cwagent-fluent-bit.yaml
Observability for EKS Fargate#
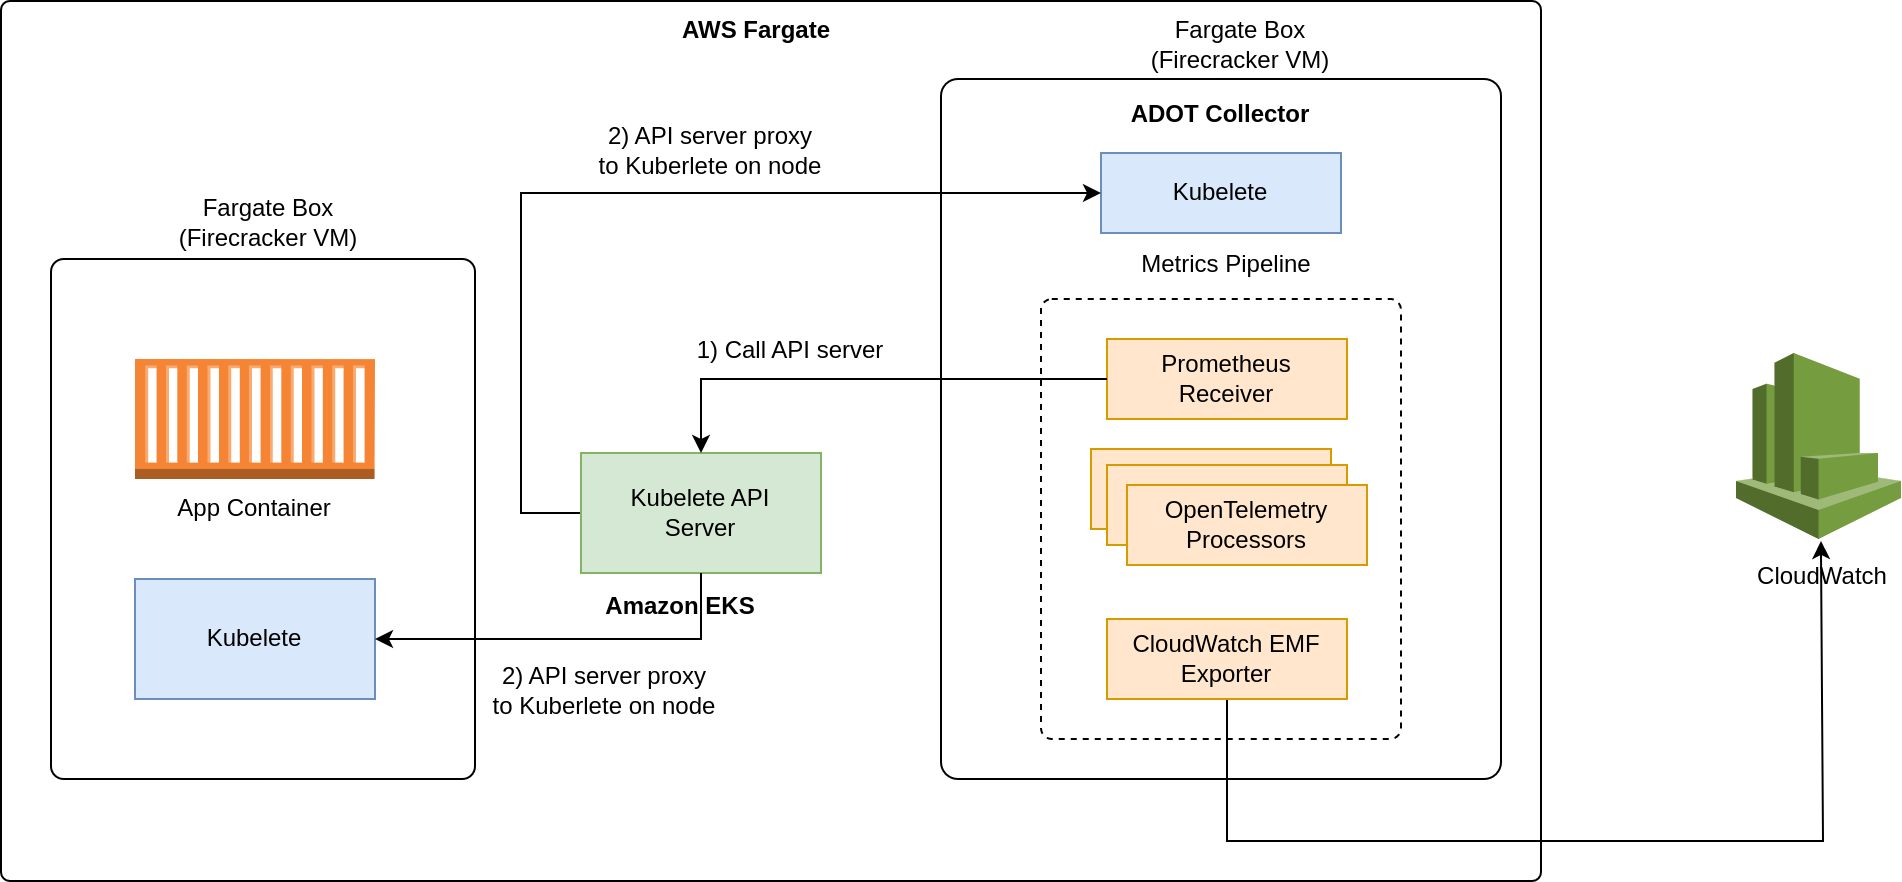
There are at least two options which are ADOT and Prometheus. This note only test with ADOT. How ADOT works in Fargate?
Quoted
The kubelet on a worker node in a Kubernetes cluster exposes resource metrics such as CPU, memory, disk, and network usage at the /metrics/cadvisor endpoint. However, in EKS Fargate networking architecture, a pod is not allowed to directly reach the kubelet on that worker node. Hence, the ADOT Collector calls the Kubernetes API Server to proxy the connection to the kubelet on a worker node, and collect kubelet’s cAdvisor metrics for workloads on that node.
- An ADOT Collector is installed in a Fargate box
- The ADOT call the API server for metrics
- The API server proxy to Kuberlete in each Fargate Box
Install ADOT in Fargate profile:
- assume the CF exection role
- install iamserviceaccount by assuming CF exection role
- install ADOT agent by using the default role
To assume CF exection role
aws sts assume-role --role-arn 'arn:aws:xxx' --role-session-name eks
Then update the ~/.aws/credentials with recevied credentials, then run the below bash script
#!/bin/bashCLUSTER_NAME=EksClusterLevel1REGION=ap-southeast-1SERVICE_ACCOUNT_NAMESPACE=fargate-container-insightsSERVICE_ACCOUNT_NAME=adot-collectorSERVICE_ACCOUNT_IAM_ROLE=EKS-Fargate-ADOT-ServiceAccount-RoleSERVICE_ACCOUNT_IAM_POLICY=arn:aws:iam::aws:policy/CloudWatchAgentServerPolicyeksctl utils associate-iam-oidc-provider \--cluster=$CLUSTER_NAME \--approveeksctl create iamserviceaccount \--cluster=$CLUSTER_NAME \--region=$REGION \--name=$SERVICE_ACCOUNT_NAME \--namespace=$SERVICE_ACCOUNT_NAMESPACE \--role-name=$SERVICE_ACCOUNT_IAM_ROLE \--attach-policy-arn=$SERVICE_ACCOUNT_IAM_POLICY \--approve
After created the iamserviceaccount, use the default role to run below command
ClusterName=EksClusterLevel1REGION=ap-southeast-1curl https://raw.githubusercontent.com/aws-observability/aws-otel-collector/main/deployment-template/eks/otel-fargate-container-insights.yaml | sed 's/YOUR-EKS-CLUSTER-NAME/'${ClusterName}'/;s/us-east-1/'${Region}'/' | kubectl apply -f -